This article walks through how to generate HAR files for troubleshooting. 🔨
Occasionally, our support team might require additional information regarding the network requests generated in your browser. In such cases, you'll need to generate a HAR file. A HAR file tracks the interactions within a web browser when an issue occurs.
Choose the browser you're recording with: 👇
01. In Chrome, go to the webpage where you are experiencing trouble.
02. At the top-right of your browser window, click the Chrome menu (⋮).
03. Select More Tools > Developer Tools. The Developer Tools window opens as a docked panel at the side or bottom of Chrome.
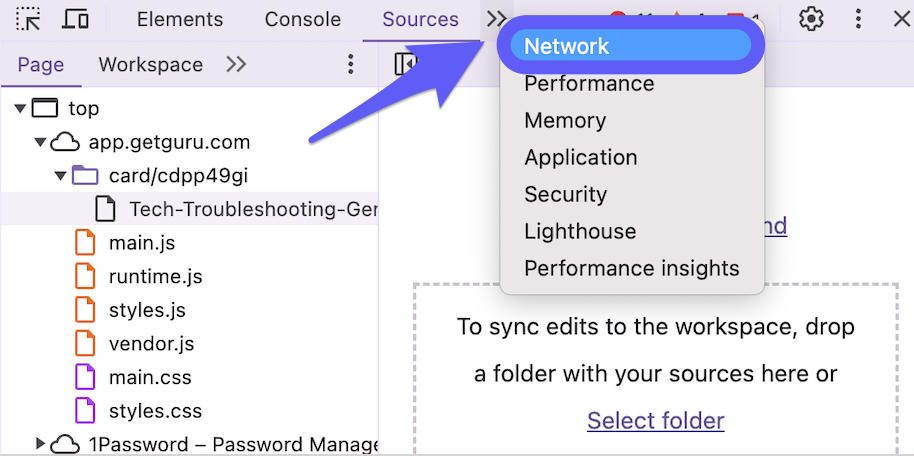
04. Click the Network tab.

05. Select Preserve log. You will see a red circle at the top left of the Network tab. This means the capture has started. If the circle is black, click the black circle to start recording activity in your browser.

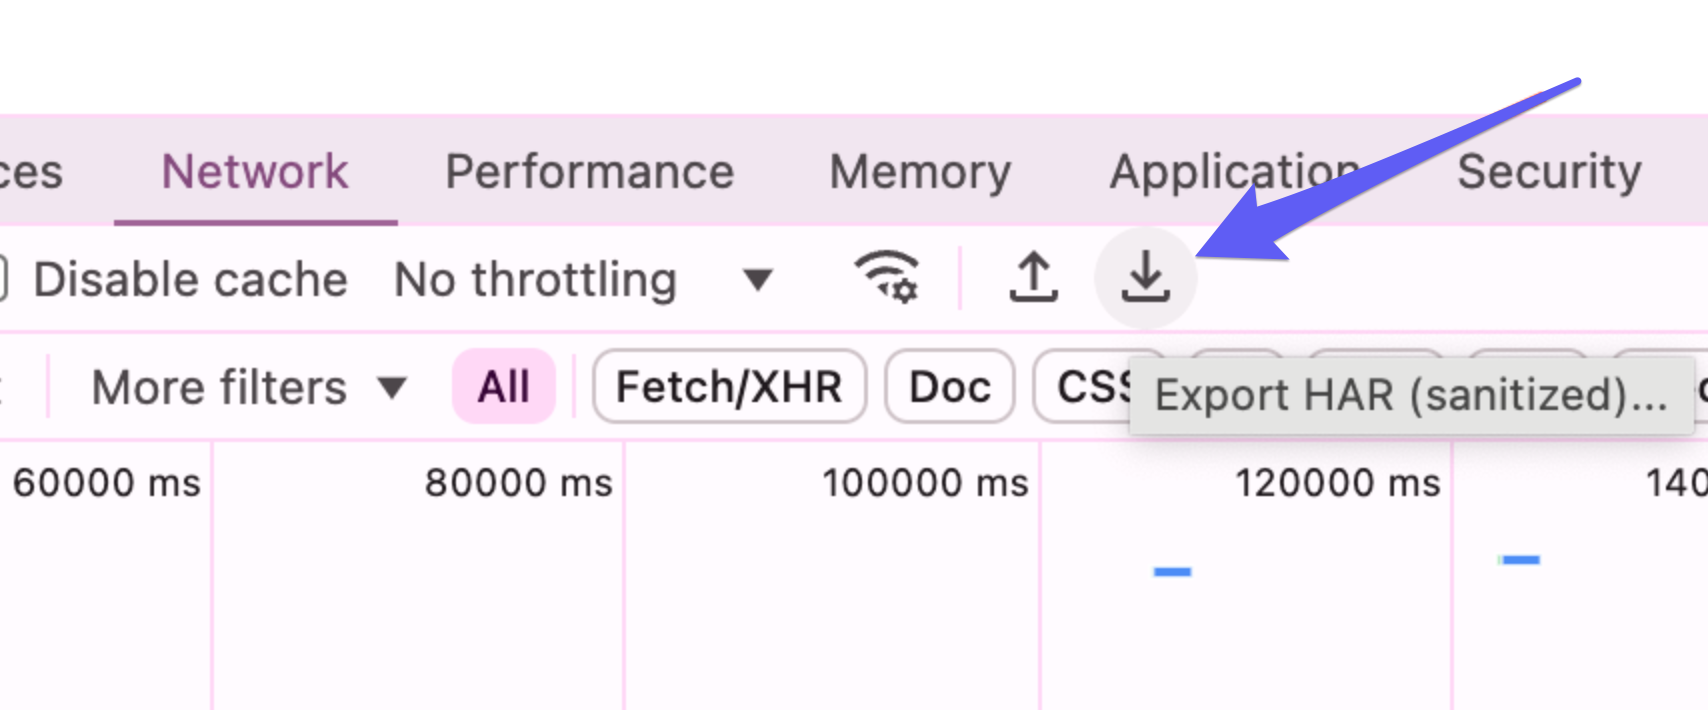
06. Refresh the page and reproduce the problem while the capture is running. After you successfully reproduce the issue, click the download icon to export the HAR file.

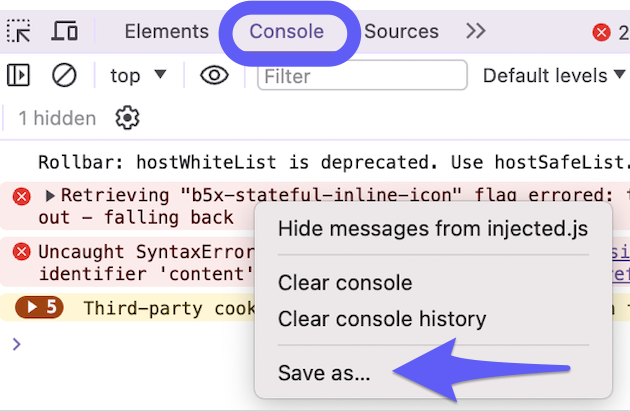
07. Select the Console tab. Right-click anywhere in the console and select Save as....

08. Name the log file Chrome-console.log.
09. Send both files to support.
02. At the top-right of your browser window, click the Chrome menu (⋮).
03. Select More Tools > Developer Tools. The Developer Tools window opens as a docked panel at the side or bottom of Chrome.
04. Click the Network tab.
05. Select Preserve log. You will see a red circle at the top left of the Network tab. This means the capture has started. If the circle is black, click the black circle to start recording activity in your browser.
06. Refresh the page and reproduce the problem while the capture is running. After you successfully reproduce the issue, click the download icon to export the HAR file.
07. Select the Console tab. Right-click anywhere in the console and select Save as....
08. Name the log file Chrome-console.log.
09. Send both files to support.
- In Firefox, go to the webpage where you are experiencing trouble.
- Click the Firefox menu (Three horizontal parallel lines) at the top-right of your browser window.
- Select More Tools > Web Developer Tools.The Developer Tools window opens as a docked panel at the side or bottom of Firefox.
- Click the Network tab. Click the settings cogwheel on the right side and select Persist Logs.
- Refresh the page and reproduce the problem while the capture is running.
- After you successfully reproduce the issue, right-click any row of the activity pane and select Save all as HAR.
- Select the Console tab. Right-click any row and select Save all messages to file, then save the file.
- Send both files to support.
- In Safari, go to the webpage where you are experiencing trouble.
- In the menu bar at the top, click Develop and select Show Web Inspector.
- Click the Console tab. Click the circle icon with 3 lines and select Preserve Log.
- Go back to the Network tab.
- Refresh the page and reproduce the problem while the capture is running.
- After you successfully reproduce the issue, click Export and save the HAR file.
- Click the Console tab. Left-click each console event starting from the top and drag to the bottom to select all
- Right-click anywhere in the selected rows and select Save Selected. Save the console.txt file
- Send both files to support.
- In Edge, go to the webpage where you are experiencing trouble.
- At the top-right of your browser window, click the Edge menu (...).
- Select More Tools > Developer Tools. Click the Network tab.
- Select Preserve Log.
- Refresh the page and reproduce the problem while the capture is running.
- Once you have reproduced the issue, click the Export HAR icon. The icon looks like a download arrow.
- Click the Console tab. Right-click any row and select Save as..., then save the file.
- Send both files to support.
Questions, comments, concerns? Contact us here.
Happy recording! 🎥 😄